Monitoring Splunk Forwarder Management Clients using Nagios
There are a few things you want to monitor in a production Splunk environment. I’m planning to release a few articles about basic Splunk monitoring. I’m checking our environment using Nagios, but the scripts should also work without any major adjustments for other monitoring solutions like Microsoft SCOM, Zappix or Openview as they all work in the same way.
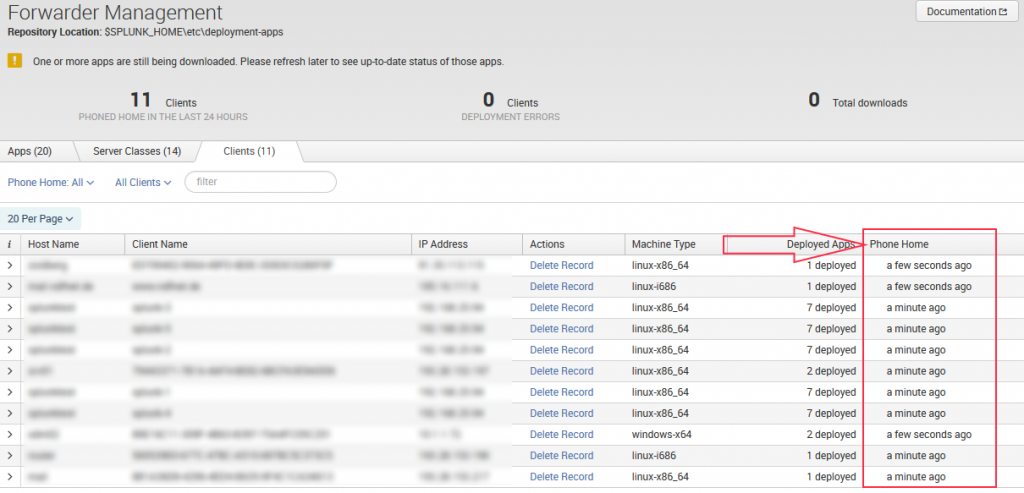
If you use Forwarder Management (also known as Deployment Server) to configure your infrastructure, you really want to make sure your Clients/Forwarders are up-and-running. In the Splunk Webpage you have a page for this within Settings->Forwarder Management:
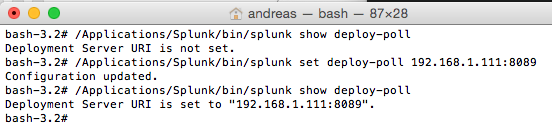
To ensure that a client is pointed to the Deploymentserver check the configuration in $SPLUNK_HOME$/etc/system/local/deploymentclient.conf or run the “splunk show deploy-poll” command. To set the Forwarder Management Server use “splunk set deploy-poll SERVER:8089″.
By default a client will call back Forwarder Management Server every 60 seconds. If communication fails the output looks like this:

The phone home interval can be configured in $SPLUNK_HOME$/etc/system/local/deploymentclient.conf using the phoneHomeinvervalinSecs Parameter.
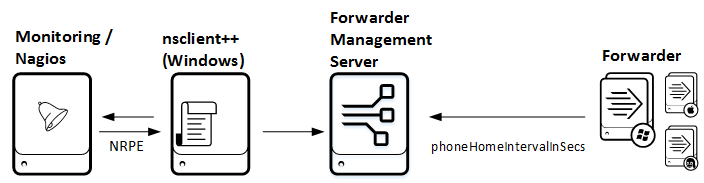
The Nagios plugin asks the Forwarder Management if every client has phoned back correctly. The plugin is a Powershell script communicating with the REST API of Splunk. For that reason the script has to be executed from a Windows device. That does not mean the Splunk instance running the Forwarder Management role has to be installed on the Windows machine. If you run Splunk on Linux or Mac you just need a Windows machine in your environment which executes the script against the non-Windows Splunk instance.
You can download the plugin from here. It uses some functions from the Splunk Powershell resource Kit which is also included in the download.
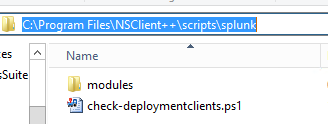
- Download and extract the files to C:\Program Files\NSClient++\scripts\splunk
- Adjust your “C:\Program Files\NSClient++\nsclient.ini” and add the external script
[/settings/external scripts/scripts]
splunkfwmanagement = cmd /c echo scripts\\splunk\\check-deploymentclients.ps1 -servername $ARG1$ -username $ARG1$ -password $ARG2$ -warn $ARG3$ -critical $ARG4$; exit($lastexitcode) | powershell.exe -command –
- On the Nagios server: create a new command using NRPE
# ‘nt_nrpe_splunkfwmanagement’ command definition
define command{
command_name            nt_nrpe_splunkfwmanagement
command_line            /usr/lib/nagios/plugins/check_nrpe -t 30 -H  $HOSTADDRESS$ -p 5666 -c splunkfwmanagement -a $ARG1$ $ARG2$ $ARG3$ $ARG4$ $ARG5$
}
- On the Nagios server: add a service to your host definition
define service{
use                             generic-service         ; Name of service template to use
host_name                       bd20.bwlab.loc
service_description             Splunk FW Management Client Connectivity
check_command                   nt_nrpe_splunkfwmanagement!localhost!admin!mypassword!5!30
}
After reloading the Nagios config you should verify the status of the check. It should look like this if everything is running smoothly.

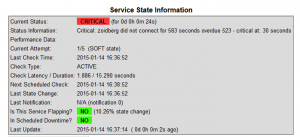
In case of an error it will look like this:

You can also run the PowerShell script manually for testing. The script accepts multiple parameters:
-servername
Servername or IP address of the Deployment Server/Forwarder Management

-port
Port of splunkd – default 8089

-protocol
Protocol to use to communicate with splunkd – default: https

-timeout
Connection timeout to splunkd in milliseconds -  default 5000

-username
Username to use to login to splunkd

-password
Password to use with splunkd

-warn
time in seconds (default 5) which a client is allowed to overdue before a warning is generated, depends on configured phoneHomeIntervalInSecs (default 60) in client settings

-critical
time in seconds (default 300) which a client is allowed to overdue before a critical is generated, depends on configured phoneHomeIntervalInSecs (default 60) in client settings
