Monitoring Splunk Forwarder Client versions using Nagios
In today’s article about Splunk monitoring we want to monitor the version of the Splunk components which are connecting to Forwarder Management. The former name of Forwarder Management was Deployment Server – which I personally prefer more as it not only configures and manages your Forwarders, but all Splunk components including Indexers and Search Heads.
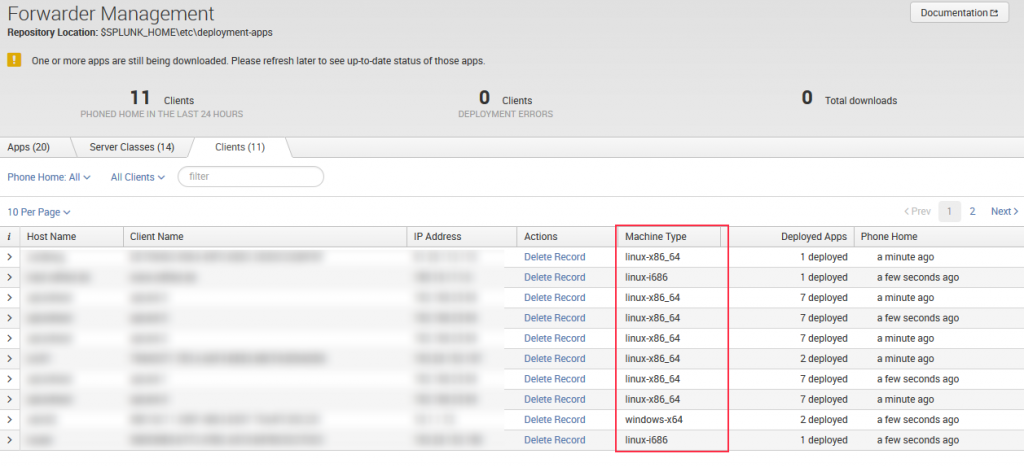
Unfortunately the Forwarder Mangement WebGUI only displays the OS platform of the client but not the Software version.
With the Nagios plugin we want ensure that all your clients (Indexers, Search Heads, Forwarders) are running at least the defined Splunk version. Otherwise an error will be generated.
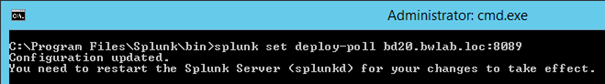
You need to have Forwarder Management implemented for this check. On the client you just need to point it to one Forwarder Management server, which can be any Splunk server in your environment. You can set the Forwarder to the Forwarder Management server with the command
$SPLUNK_HOME$/bin/splunk set deploy-poll bd20.bwlab.loc:8089
and check using
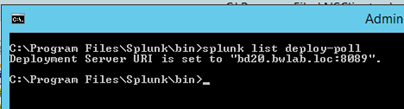
$SPLUNK_HOME%/bin/splunk list deploy-poll
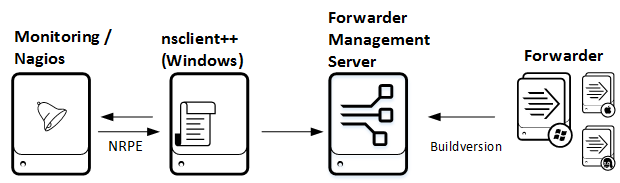
The Nagios plugin queries Forwarder Management for the client list and compares every client against a minimum build level you can define. The plugin is a Powershell script communicating with the REST API of Splunk. For that reason the script has to be executed from a Windows device. That does not meanthe Splunk instance running the Forwarder Management role has to be installed on the Windows machine. If yourun Splunk on Linux or Mac you just need a Windows machine in your environment which executes the script against the non-Windows Splunk instance.
You can download the plugin from here. It uses some functions from the Splunk Powershell resource Kit which is also included in the download.
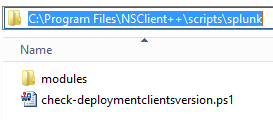
In this example the Forwarder Management server runs on the same machine like the Nagios client nsclient++. If you need to do an indirect query, because your Splunk server is running on a non-Windows machine simply adjust the IP in the Nagios service definition.Download and extract the files to C:\Program Files\NSClient++\scripts\splunk
- Download and extract the files to C:\Program Files\NSClient++\scripts\splunk
- Adjust your “C:\Program Files\NSClient++\nsclient.ini” and add the external script
[/settings/external scripts/scripts]
splunkfwmanagementversion = cmd /c echo scripts\\splunk\\check-deploymentclientsversion.ps1 -servername $ARG1$ -username $ARG2$ -password $ARG3$ -minbuild $ARG4$; exit($lastexitcode) | powershell.exe -command –
- On the Nagios server: add a service to your host definition
use generic-service ; Name of service template to use
host_name bd20.bwlab.loc
service_description Splunk FW Management Clients Version
check_command nt_nrpe_splunkfwmanagementversion!localhost!admin!mypassword!220630
}
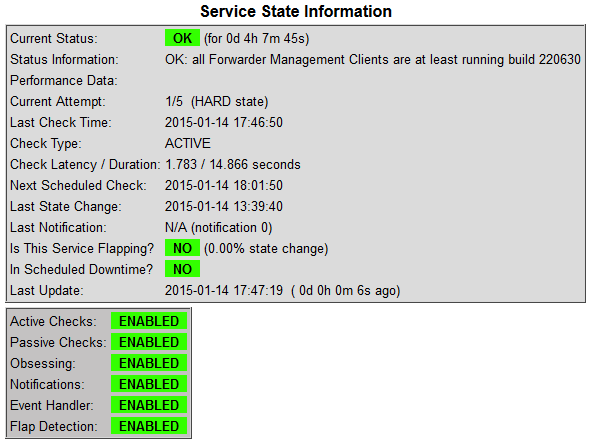
After reloading the Nagios config you should verify the status of the check. It should look like this if everything is running smoothly.

Parameters
You can also run the PowerShell script manually for testing. The script accepts multiple parameters
-servername
Servername or IP address of the Deployment Server/Forwarder Management

 -port
Port of splunkd – default 8089

-protocol
Protocol to use to communicate with splunkd – default: https

-timeout
Connection timeout to splunkd in milliseconds – default 5000

-username
Username to use to login to splunkd

-password
Password to use with splunkd

-minbuild
Build version of client to check. has to be passed as an integer value. if client runs on a lower build version a critical message will be is generated
example build numbers
version 4.3.3 = build 128297
version 6.0.2 = build 196940
version 6.1.1 = build 207789
version 6.1.3 = build 220630
version 6.1.4 = build 233537
version 6.1.5 = build 239630
version 6.2.0 = build 237341
version 6.2.1 = build 245427