1000 percent speed up for Get-vCOpsResourceMetric
Currently VMware does not provide a PowerCLI snapin to access the vCenter Operations API (the HttpPostAdapter). Clint Kitson and Alan Renouf have developed a Powershell Module to fill that gap.
The Module provides the CMDlets Get-vCOpsResourceAttributes, Get-vCOpsDBQuery and Get-vCOpsResourceMetric. I use Get-vCOpsResourceMetric in a customer project to fetch the “Active Memory” of virtual machines to calculate new RAM reservation values. The Module has saved me a lot of development time, but the runtime is too high if you have more than a few VM’s.
The Get-vCOpsResourceMetric CMDlet uses several Arrays to process the metric data that has been fetched from vCenter Operations. I have replaced that arrays with LinkedLists, because if you have many entries in the arrays they are really slow in Powershell/.net. Since Luc Dekens has provided that hint in his PowerCLI session during VMWorld 2011, i use it in many scripts to raise the performance of my scripts. You can find some additional infos on James Brundage’s page start-automating.com. I also moved the creation of PSobject that contains the final data structure out of the inner foreach loop and i have removed the date conversion from the CMDlet. Especially the date conversion from Unix time stamp to a local date format is very time consuming. The PSoject still includes the timestamp and you can make the conversion in a later step if you need that for some metrics. You can download the updated version of the ps_vcops.psm1 Module. Maybe Clint and Alan can update the original version to include the changes and provide a option to enable the date conversion.
| original script | optimized script with date conversion | optimized script without date conversion | |
|---|---|---|---|
| CMDlet | Get-vCOpsResourceMetric | Get-vCOpsResourceMetricoptimizeddateincluded | Get-vCOpsResourceMetricoptimized |
| Metric | mem|active_average | mem|active_average | mem|active_average |
| Timeframe | 180 days | 180 days | 180 days |
| # Values | 30557 | 30555 | 30555 |
| Runtime | 0h 4m 54s | 0h 3m 15s | 0h 0m 28s |
| Runtime per Value | 0.009631s | 0.006371s | 0.000916s |
| Speed up | 151,16% | 1051,41% |
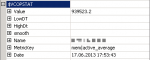
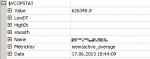
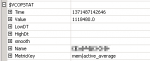
I have used that calls to run the CMDlets and they provide the data shown in the screenshots:
$VM | Get-vCOpsResourceMetric -metricKey “mem|active_average” -startDate (Get-Date).AddHours(-4320) -includeDt:$false -includeSmooth:$false
$VM | Get-vCOpsResourceMetricoptimizeddateincluded -metricKey “mem|active_average” -startDate (Get-Date).AddHours(-4320) -includeDt:$false -includeSmooth:$false
$VM | Get-vCOpsResourceMetricoptimized -metricKey “mem|active_average” -startDate (Get-Date).AddHours(-4320) -includeDt:$false -includeSmooth:$false
If you have more than a few VM’s in your environment or you want to use a big timeframe for your vCOps metrics this optimization gives you big time savings. For more information about the usage of the HttpPostAdapter open the documentation url [https://vcopshost/HttpPostAdapter] of your vCOps installation.
Thanks to Clint and Alan for developing that Module!