useful widgets to get fast answers in vCenter Operations
vCenter Operations provides different widgets to display the data collected from vCenter, storage systems or other data sources. Using the example of finding out which of the VMs in a vCenter are affected by high cpu ready % values i show you how to use heatmaps, metric graphs and data distribution widgets.
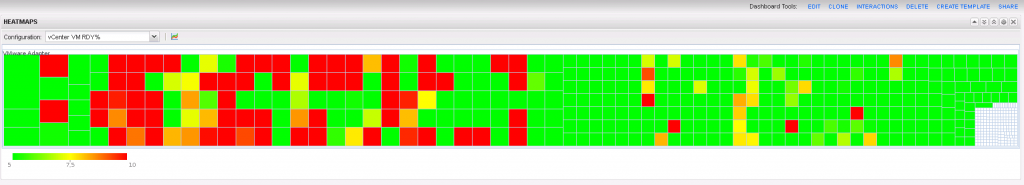
Heatmaps can display the current status of many objects (even thousands) in one clear view. It gives you a quick answer for which datastores have a high latency, which cluster have the most ballooning virtual machines, which ESX hosts are currently not available in which cluster and so on. This screenshot displays a heatmap configuration that shows all virtual machines in a vCenter, how many vCPUs they have configured (the size of the square) and how high their cpu ready % values are. If the values are higher than 5% the color changes from green to red (10% or more). As i have described in part 3 of “using super metrics…” you can create interactions between the widgets to “handover” the a metric from the selected object to another widget. If you click on a VM in the heatmap the “ready %” metric will be drawn in the metric graph and also in the data distribution widget if you configure both.
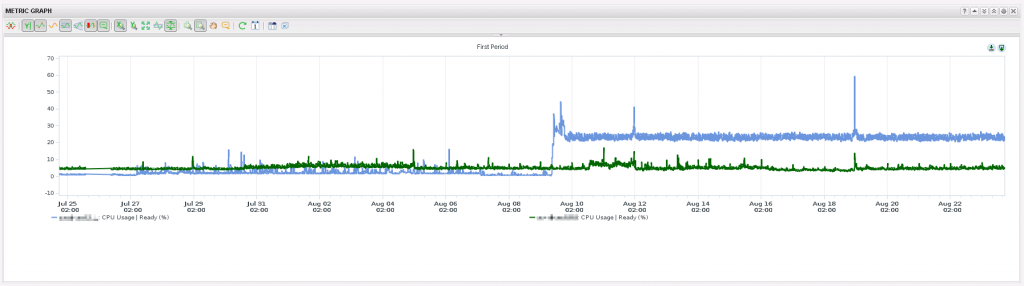
Metric graphs draw a metric for one or more objects over a configured timeframe. They are good to understand the history and development of an object. For instance how high was the cpu usage of a ESX host or cluster a week ago, how fast does a datastore fill up with vmdk’s, how many lost packets had that network interface yesterday and so on. I have selected two VMs with different % ready values from the heatmap. In the metric graph i have combined both metrics, but it also possible to draw multiple graphs in one widget. This is useful if you have many metrics to compare or if you would zoom in a single graph. The screenshot shows a different history for the both virtual machines. The blue VM has very high values since august the ninth. Both run in the same vCenter, but maybe on different ESX hosts. The graph gives you an indication of what could be the problem. You can drill down into the virtual machine to see on which host it runs, check if the host has problems and if other VMs on that host are also affected.
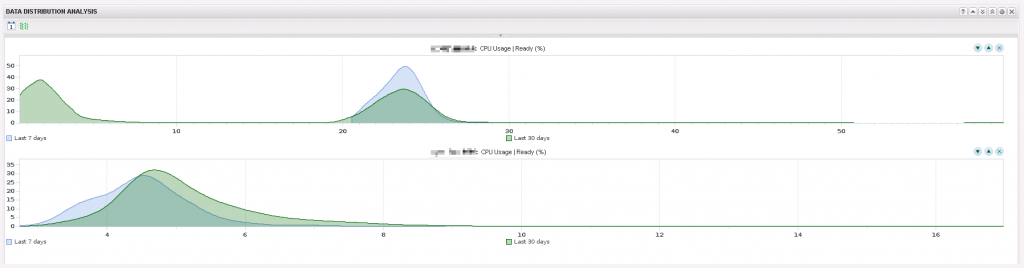
Data distribution widgets are more complex and harder to read, but they display how the values are distributed even over two timeframes. With them you can answer what was the cpu usage for a virtual machine most of the time in the last seven days and also for the last 30 days. The same is possible for IOps or latency of a datastore or the availability of a ESX host. Because i have selected the two virtual machines in the heatmap and i also have configured interactions for metric graphs and data distribution widgets, they will show up also in this widget. The screenshot shows the graph for both VMs and the configuration for seven and 30 days. The virtual machine on top has most of the ready % values between 20-25% in the last seven days and between 0-5% plus 20-25% in the last 30 days. This virtual machine has more problems in the last seven days then in the weeks before. If you compare it with metric graph you will see that this is the blue VM. The other VM has slightly better values in the last seven days than in the last 30 days and in that case it is more visible than in the metric graph. The Y axis in the graphs shows the percentage for the distribution of the values. For the top VM it means nearly 50% of the time the ready values in the last seven days were around 23.5% (the blue spike).
I think the vCenter Operations widgets prove that data visualization is very important and helpful to give educated answers about the health of your virtual infrastructure. With the integration of more data sources and automatic relationship configuration vCOps becomes even more valuable.